Not everything that is collected for recycling actually gets made into a new product. Breakage and contamination of collected materials often results in them being "downcycled" into something that cannot be recycled again, or sometimes just simply discarded. Beverage containers collected through a deposit system typically suffer less breakage and contamination than those collected through other systems; that means more bottle bill containers can be recycled into new containers than containers recycled through other means.
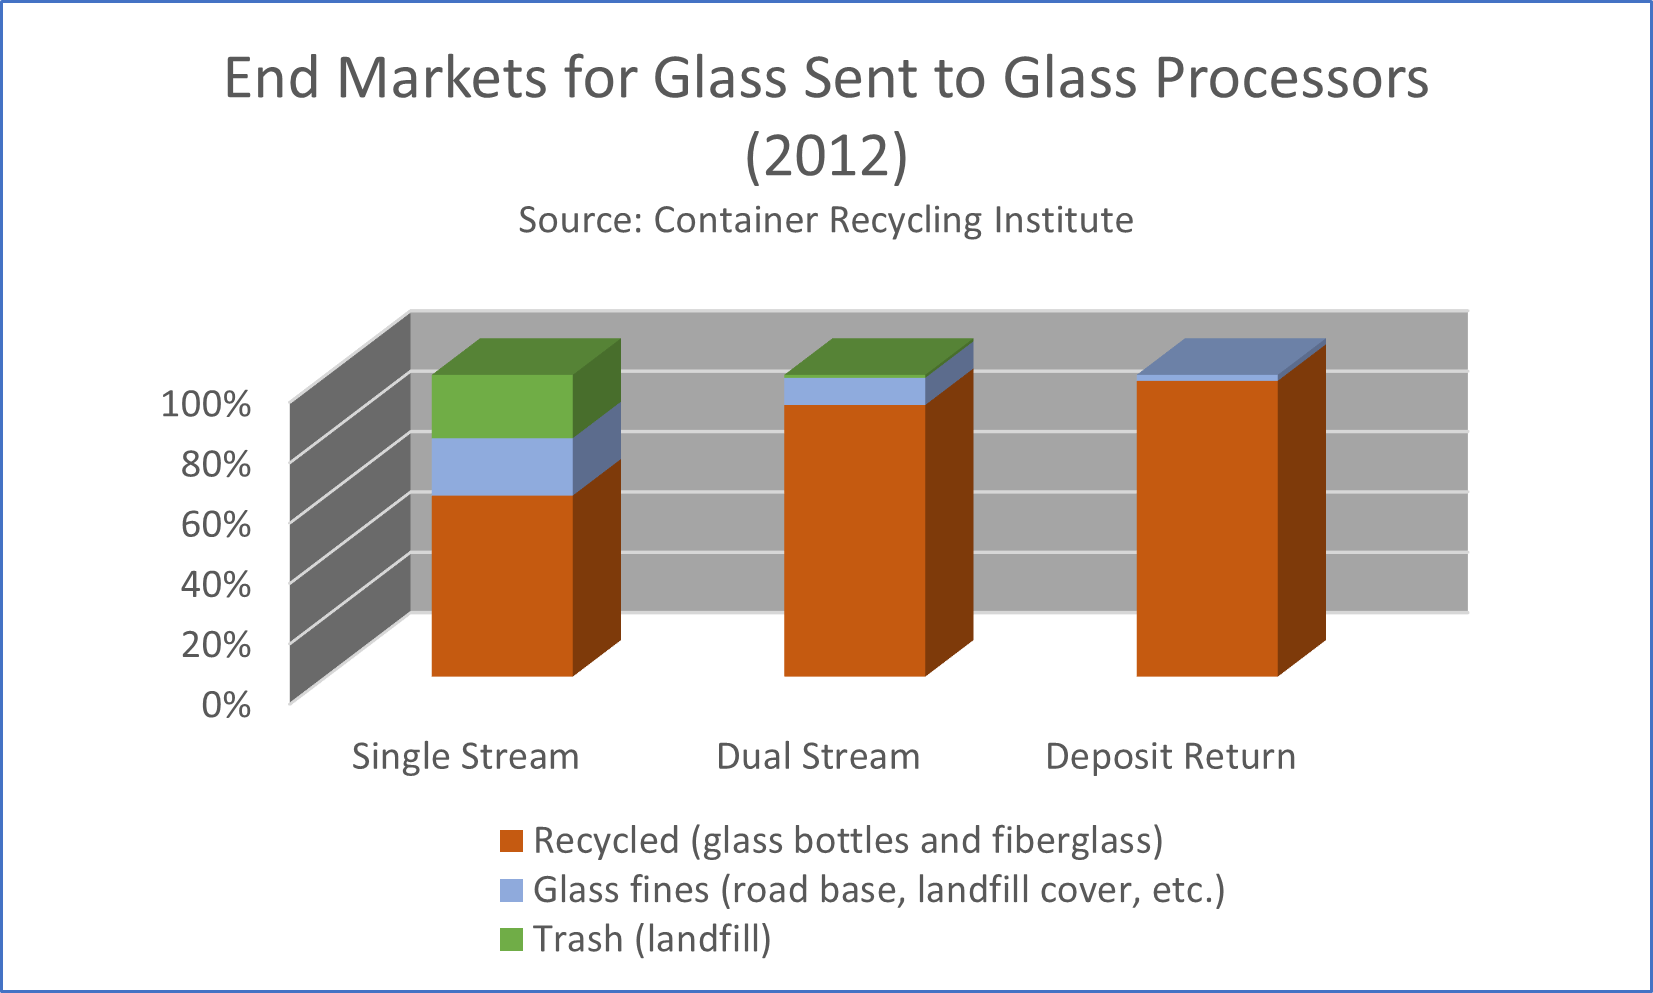
A survey of a dozen glass processing facilities indicated that, on average, only 60% of glass from single-stream collection is recycled into containers and fiberglass. 19% is small broken glass ("glass fines") used for low-end applications such as road base or landfill cover, while the remaining 21% is unusable and sent directly to landfill. [1] In contrast, mixed glass from dual-stream systems yields an average of 90% being recycled into containers and fiberglass, with the remaining 10% being glass fines used for low-end applications. Almost none of the glass in dual-stream systems get sent to landfill. In deposit systems, 98% of collected glass material is recycled and only 2% is marketed as glass fines. [2]
However, glass collected through the curbside system is not guaranteed to reach a glass processor; the non-profit organization Northeast Recycling Council, Inc. (NERC) released a 2018 study stating that only "54% of the reported glass tonnage from Northeast MRFs are sent to glass processors to be cleaned." [3] Over 38% of the remaining MRF glass is sent directly to landfill, as follows: as landfill cover (23.5%), roadbase/fill (0.5%), and as trash (14.7%). None of the remaining glass is sent for use to fiberglass manufacturers.
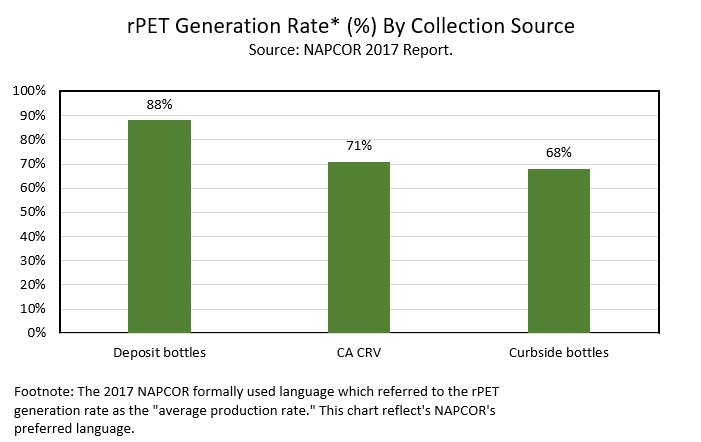
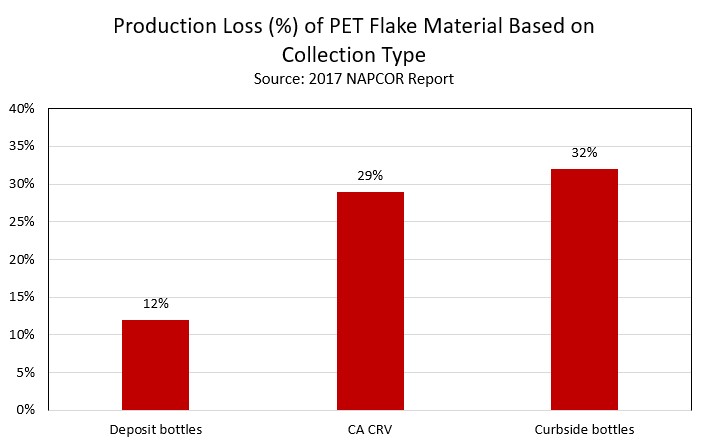
A 2017 annual report by the National Association for PET Container Resources (NAPCOR) analyzed the production rate for clean flake of US PET bottle material depending on the collection type. They reported that the production rate for curbside collection is 68%, while deposit bottles had a collection rate of 88%. Bottles collected under California CRV have a production rate is 71%. [4] This indicates that curbside collection has a loss of 32% of PET bottle material that could not be used to produce clean flake. Deposit bottles have only a 12% loss while California CRV material has a 29% loss.
Bottle Bills Create Material That is 100% Food-Grade
In the United States, only food-grade material is considered to be compliant to regulations for food packaging. Due to the fact that deposit programs only collect beverage containers, all material collected through deposit systems only contain 100% food-grade material. However, PET bottles collected through curbside may suffer food-grade quality degradation issues due to being recycled alongside non-food grade plastics. A 2021 report by Stina Inc. determined that "Curbside collected PET is more likely to include both food and non-food containers, as well as opaque PET containers and missorted non-PET plastics." [5]
Non-food grade plastics include additives, inks, and other chemicals not included in food-grade plastic, which makes them unsuitable for processing into food-grade plastic due to the risk of contamination. Because curbside collection commingles food-grade and non-food grade containers, both are often processed together at MRFs. This risks the non-food grade material contaminating any food-grade material, making it unsuitable to be utilized again as food-grade material. The 2021 Stina Inc. report states, "The convenience of mixed collection of materials increases consumer participation, but also increases overall contamination of the various materials collected. This makes the material more challenging for a recycler to process, but especially for any plastic recycler that is trying to make a recycled plastic for food-contact applications." [6]
In contrast, The Stina Inc. report further notes that deposit systems produce "readily recyclable high-quality material" for food-contact applications. Organizations like the European PET Bottle Platform EPBP are already currently working towards increasing the quantity of food-contact recycled PET in Europe, by partnering with initiatives like Recyclass to update testing protocols and reevaluating PET bottle design to work better with recycling infrastructure. EPBP Board Member Philippe Diercxsens states, “Working together to safeguard food contact rPET with the highest quality in a bottle-to-bottle closed loop will be a key enabler for the industry toward its commitments." [7]
Footnotes
[1] "A Common Theme." (Print.) Susan Collins. Container Recycling Institute. Reprinted from Resource Recycling Magazine. February 2012.
[2] Ibid.
[3] "NORTHEAST MRF GLASS SURVEY REPORT: OCTOBER 2018." Remolador, Mary Ann. Northeast Recycling Council, Inc. October 2018.
[4] "Report on Postconsumer PET Container Recycling Activity in 2017." National Association for PET Container Resources (NAPCOR). 15 November 2018.
[6] Ibid.
[7]"RecyClass and EPBP unite to secure rPET supply chain as recyclability targets loom." Gore-Langton, Louis. Packaging Insights. 27 January 2022.
Last Updated on 1 February 2022.